Same effort, different score: The wildly uneven grading systems of South America
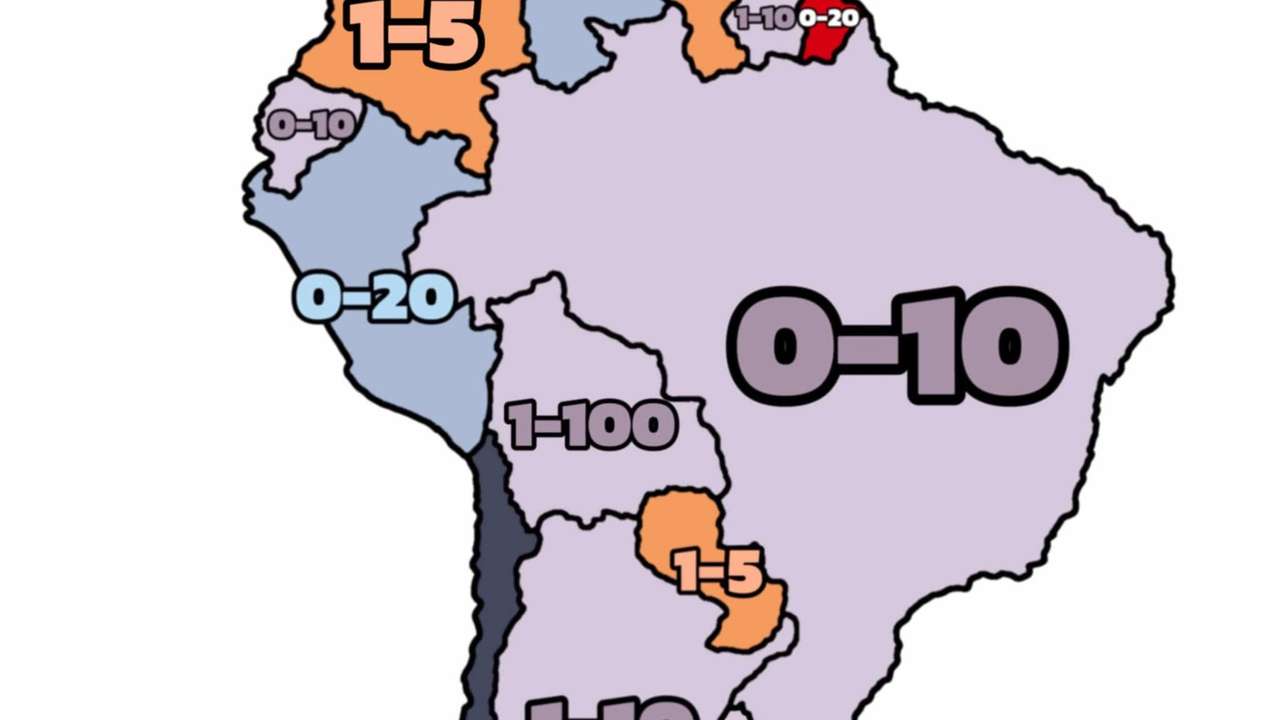
In a striking visual overview of educational systems across South America, the grading scales used by countries vary widely, reflecting the region’s complex histories and educational infrastructures.
The map shows how school grades are awarded from “worst” to “best,” with ranges like 0–10, 1–5, 0–20, and even 1–100 appearing in different nations. While superficially this might look like a quirky oddity, it actually reveals deeper truths about how schooling and standards operate in Latin America.
For one, when students and transcripts cross borders, for university admissions or migration, these differences complicate things. A “7” in one country might be equivalent to a “C” in another, while a “14” on a scale of 20 might translate differently again.
According to a global overview of grading systems, South America frequently uses numerical scales like 1–10 or 0–20 instead of the letter-grade models seen elsewhere.
RECOMMENDED FOR YOU

More than 6 billion people are now online as global internet access reaches new high
In particular:
- In Argentina, grades often run from 1 to 10, with a “7” being roughly equivalent to a passing mark of around 70%.
- In Brazil, schools may use a 0–10 scale, or even a percentage system from 0–100, depending on the state or institution.
- In Colombia, the common secondary-school system uses a 0–5 or 0–10 scale; higher education may use 0–5.
These variations matter not just academically, but socially: they mirror differences in school resources, quality of instruction, and the rural-urban divide across Latin America.
For example, a recent review points out that the educational systems in South America are characterised by “inconsistencies and largely correlate to the economy of the countries” — meaning that how you’re graded may depend heavily on where you live and the school you attend.
What the map shows at a glance
- Some countries use a 0–20 scale (meaning 20 is the best grade).
- Others use 1–5 or 1–10, where the top end is the best.
- Some countries adopt 0–10, or even 1–100 (more rarely).
- The passing mark, workload, and expectations can differ drastically even inside a country, particularly between private and public schools.
The global and contemporary link
This diversity of grading scales comes at a moment when higher education and student mobility are more international than ever. For example, with the rise of online learning, cross-border student exchanges and global credentials, universities must interpret these varied grading systems.
Meanwhile, more broadly, Latin America is facing intense pressure to improve educational outcomes.
A recent study analysing data from the Programme for International Student Assessment (PISA) 2022 for nine Latin American countries found significant “efficiency gaps” between public and private institutions, meaning that even given the same resources, outcomes varied sharply.
Grading systems, and their interpretation, become one piece of this larger puzzle of equity, access and quality in education.
RECOMMENDED FOR YOU

Indebted Argentines march in Buenos Aires over rising household debt
This story is written and edited by the Global South World team, you can contact us here.