China overtakes dozens of economies in GDP per person after decades of rapid growth
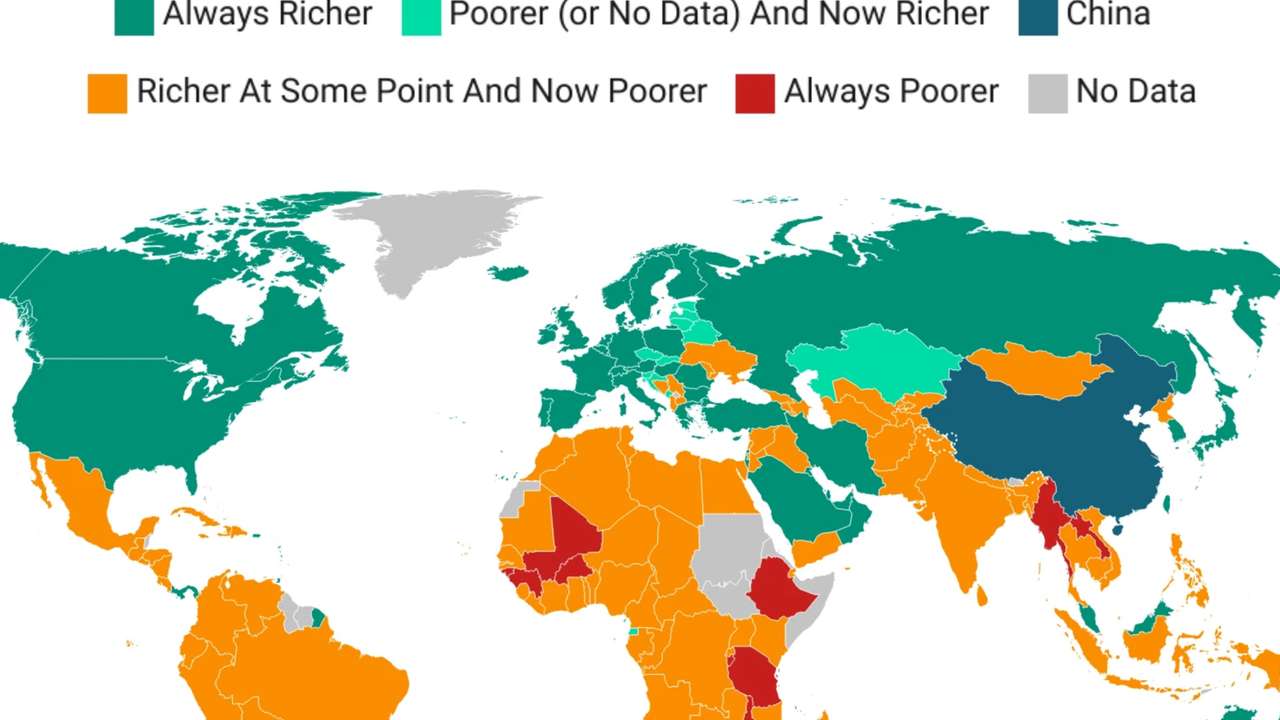
China has moved from being one of the world's poorer economies in the mid-20th century to overtaking dozens of countries in economic output per person, according to historical data showing how dramatically its position has changed since 1950.
Key points
- China was among the world's poorer economies in 1950
- Rapid growth pushed it ahead of many countries
- Richer economies still lead China in GDP per person
China has moved from being one of the world's poorer economies in the mid-20th century to overtaking dozens of countries in economic output per person, according to historical data showing how dramatically its position has changed since 1950.
A map based on the Maddison Project Database, published by Brilliant Maps and reproduced by The World in Maps, compares countries' GDP per capita with China's over time.
It shows that China has moved ahead of many countries in Latin America, Africa and Asia that were once wealthier on a per-person basis. However, the United States, Canada, Japan, Australia and much of Western Europe remain ahead.
The comparison is about GDP per person, not the total size of an economy. China has one of the world's largest economies, but dividing its output among its population produces a very different international ranking.
RECOMMENDED FOR YOU

Serbia election 2026: Student-led movement wins parliamentary majority, ending Vučić's grip on power
From near the bottom to a major economic power
In 1950, China's GDP per capita was estimated at just $799, adjusted for inflation and differences in living costs. That placed it among the world's poorest economies.
By 2020, the figure had risen to approximately $17,226, more than 21 times its 1950 level, according to the Maddison-based figures compiled by Brilliant Maps.
China's transformation accelerated after economic reforms began in 1978, opening the country to more private enterprise, foreign investment and international trade. The World Bank estimates that China's economy subsequently grew by an average of more than 9% annually for several decades, helping lift nearly 800 million people out of extreme poverty.
Countries that China has overtaken
The map highlights how China's economic position has changed relative to other countries.
Much of Latin America, including Brazil, Argentina and Mexico, had higher GDP per person than China during earlier decades but had fallen behind it by 2020.
A similar pattern appears across parts of Africa and Asia, including South Africa, Egypt, India and Indonesia. These countries were ahead of China at some point in the historical comparison but were below it at the end of the period.
Meanwhile, countries such as the United States, Germany, Japan, South Korea and Australia remained richer per person.
The map also identifies countries that have consistently remained below China, including several economies in sub-Saharan Africa.
RECOMMENDED FOR YOU

Europe recruits migrant workers. So why doesn't it tell them how to see a doctor?
What the comparison actually measures
The historical figures use purchasing power parity (PPP), which adjusts for differences in prices between countries, as well as inflation. This makes them more useful for comparing economic output across different periods than simply converting national GDP into US dollars at market exchange rates.
However, GDP per capita is an average. It does not show how income is distributed, how much households earn or how living standards differ within a country.
There is also an important date distinction. Although the map says since 1950, the underlying Brilliant Maps comparison ends in 2020, not 2026. The Maddison Project's 2023 database provides a more recent historical series extending to 2022.
This story is written and edited by the Global South World team, you can contact us here.